

Optimizing Cloud Migration: A Financial Analysis Guide
Ever wondered why some companies see significant cost savings on their cloud investments while others struggle? Success depends on a well-structured financial analysis. Many organizations focus only on migration costs, missing the bigger picture—cloud adoption isn’t just about moving workloads, it’s about financial efficiency and long-term value.
Without the right financial framework, businesses risk overspending, poor resource allocation, and underwhelming ROI.
This guide breaks down how to use Tidal Accelerator’s Financial Impact Tool to build a comprehensive analysis that ensures every cloud investment delivers measurable value.
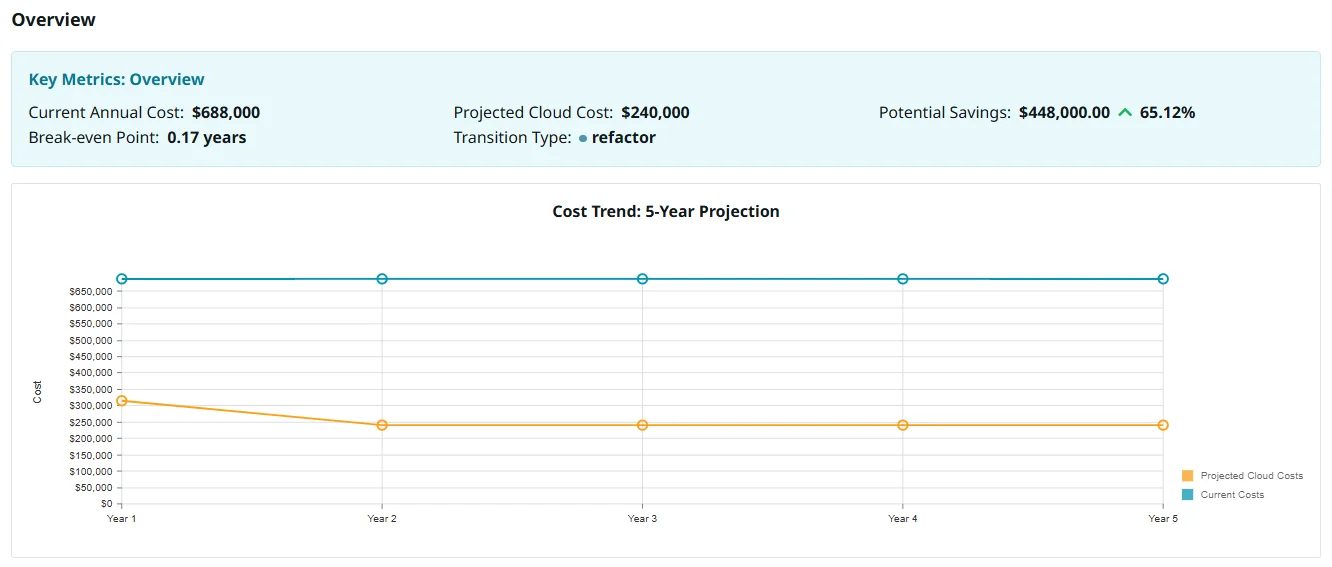
Key Metrics Overview showing the 5 Year Cost Trend Projection
Prerequisites
- Access to Tidal Accelerator
- Basic understanding of your current infrastructure costs
- List of applications you plan to analyze

Step 1: Understanding Migration Strategies (6 R's Framework)
Before diving into numbers, you need to select the right migration strategy. Think of it like choosing between buying a new car or upgrading your existing one—your decision impacts both upfront costs and long-term value.
The Four Strategies Supported by Tidal Accelerator:
- Rehost (Lift & Shift) – Quick wins, lower initial costs, minimal modifications
- Replatform – Moderate optimization, balancing cost and performance
- Refactor – Higher upfront costs, maximum long-term savings with cloud-native capabilities
- Retire – Immediate cost savings by removing applications that no longer serve business needs
Some organizations also consider Retain (keeping workloads on-prem) or Repurchase (replacing legacy systems with modern, cloud-based solutions). They play a role in cloud decision-making. Learn more about the 6 R’s Framework.
💡 Pro Tip: Don’t just pick the cheapest option. A slightly higher initial investment can lead to larger ROI through improved efficiency, automation, and scalability.

Step 2: Setting Up the Financial Impact Tool
If Starting From Scratch:
1. Create a New Project in Tidal Accelerator
- Go to Projects
- Click ‘Add Project’
- Enter your project details
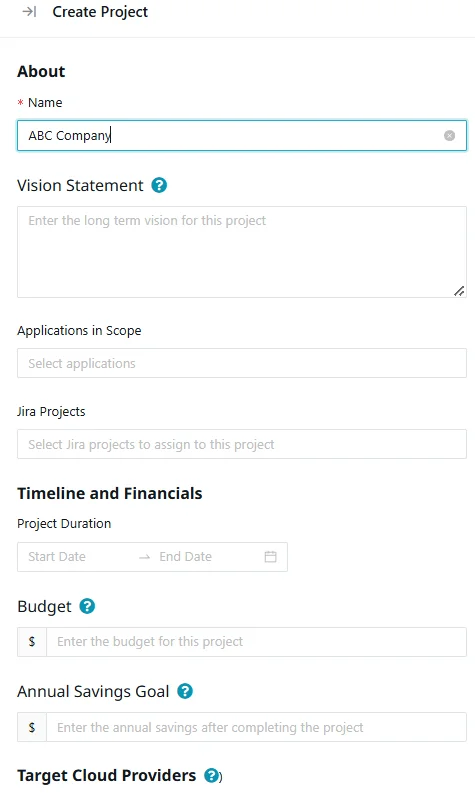
Create a new project
2. Add Applications
- Navigate to Inventory > Applications
- Click ‘+ New’
- Enter application details
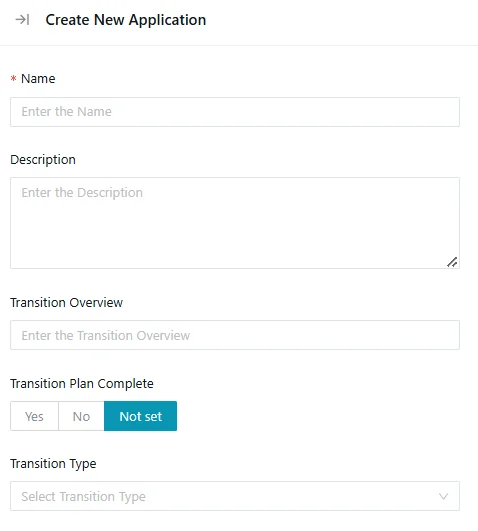
Create a new application with the Application name and essential information
3. Enter Baseline Costs
- Open Application Overview
- Locate Financial section
- Input current costs (hosting, staff, etc.)
4. Access Financial Impact
- Open your project
- Click ‘Financial Impact’ tab
For Existing Projects:
- Open your project in Tidal Accelerator
- Click ‘Financial Impact’ tab
- Review cost breakdowns and savings insights
- Enter your financial details
💡 Pro Tip: Begin at the project level for a high-level view before drilling into application details.

Step 3: Breaking Down Your Costs
Navigate to Application Overview and enter cost details in the Financial section. These costs will be included in the Financial Impact assessment, serving as the baseline for cost comparisons.
Below are the available financial classifications, though not all will be used in this example.
- License Costs: Pre- and post-migration software fees, e.g. Oracle DB
- Subscription Costs: Costs related to service subscriptions, e.g. $500 p.a. for Auth0, $3,000 for CloudFlare CDN
- Maintenance and Support: Staff and operational costs, e.g. $60k p.a. in FTE costs
- Development Costs: Ongoing development expenses and investments, e.g. $375k p.a. in outsourced development fees
- Server Costs: Infrastructure expenses, e.g. $89k in server amortization, network, power/cooling, floorspace etc.
Accurately categorizing these expenses allows you to compare current versus projected cloud costs, identify cost-saving opportunities, and refine your migration strategy.
💡 Best Practice: Define cost categories before entering data—mixing licensing with infrastructure costs can distort ROI calculations and impact decision-making.
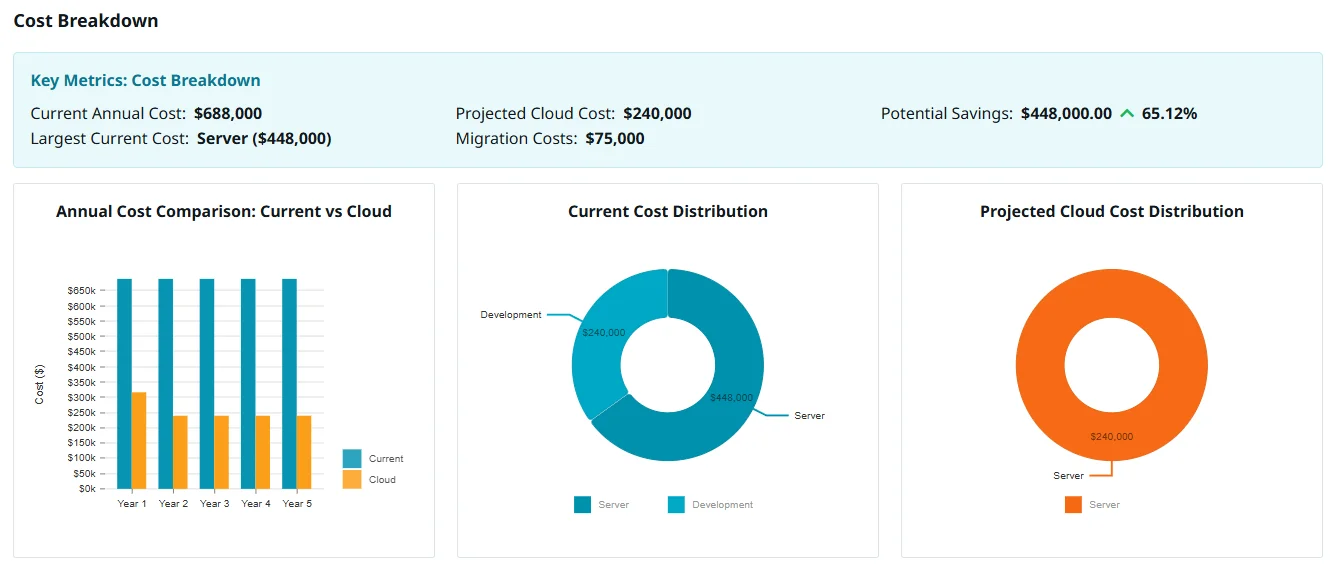
The cost breakdown view takes shape showing graphs to visualize and compare your journey
💡 Tip: If cloud instance recommendations are enabled, projected costs auto-populate—but you can manually adjust them to match actual costs.
Step 4: Entering Cost Data
Using Existing Fields:
- Navigate to your application
- Open Overview tab > Financial section
- Enter current costs
- Switch to Migration tab > Transition Planning
- Enter forecasted cloud costs
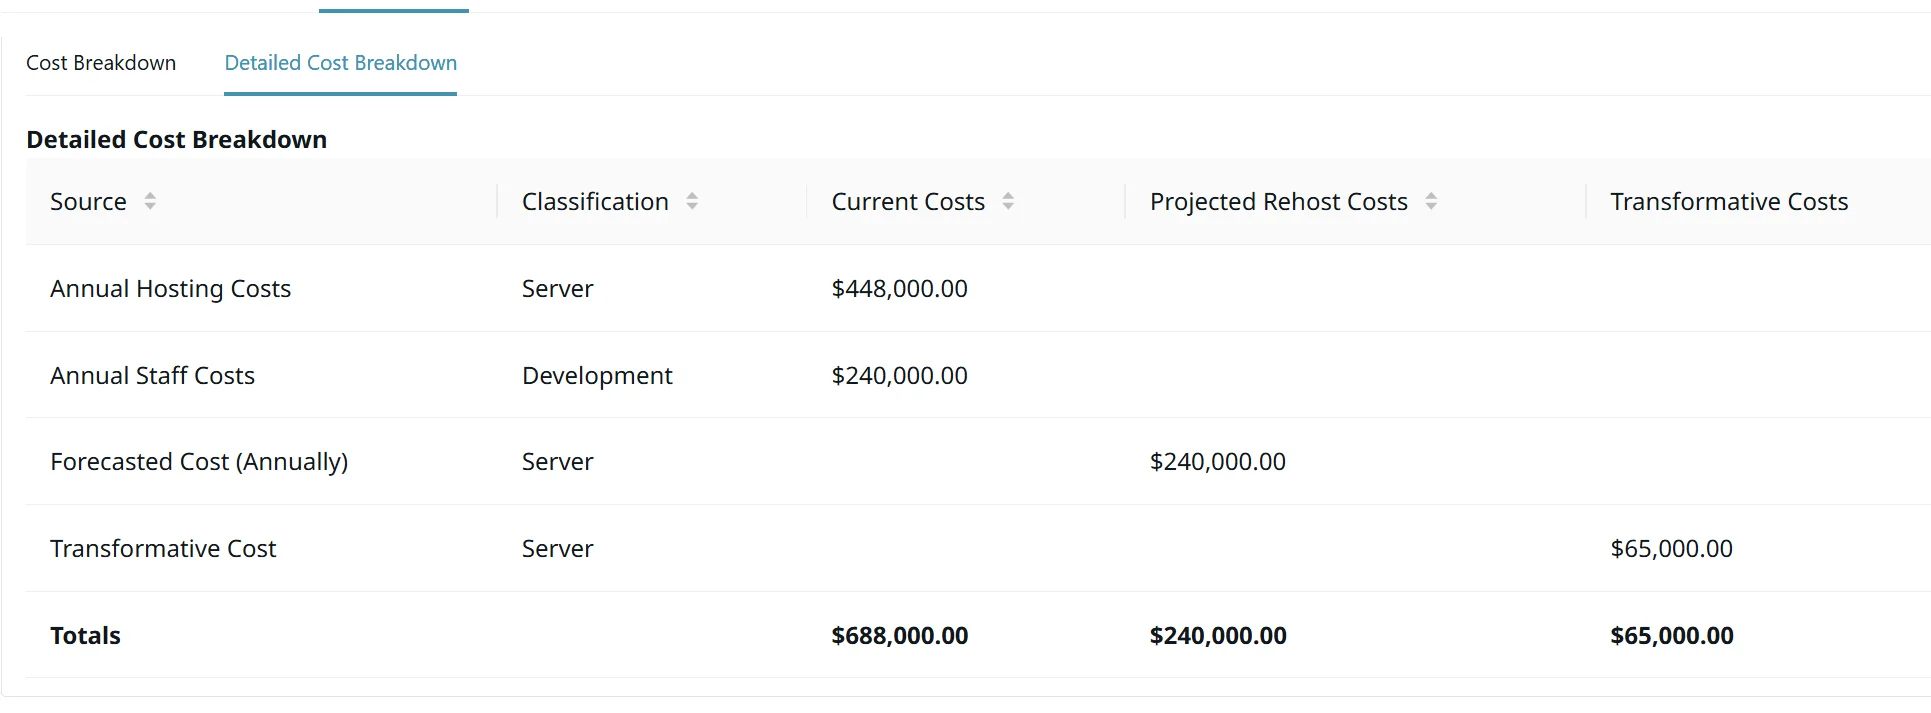
Detailed Cost Breakdown shows the classification and costs of each source
Creating Custom Cost Fields:
- Go to Settings > Fields
- Click ‘+ New’
- Select category and classification
- Enter cost data
For example, license costs can be split into two fields:
- On-premises license costs → categorized under Financial as a current cost
- Cloud license costs → categorized under Transition Planning as a future state cost
💡 Tip: When creating custom license fields, add the cloud provider name (e.g., AWS, Azure, Google Cloud) before the source name.
This separation ensures accurate financial reporting and classification.
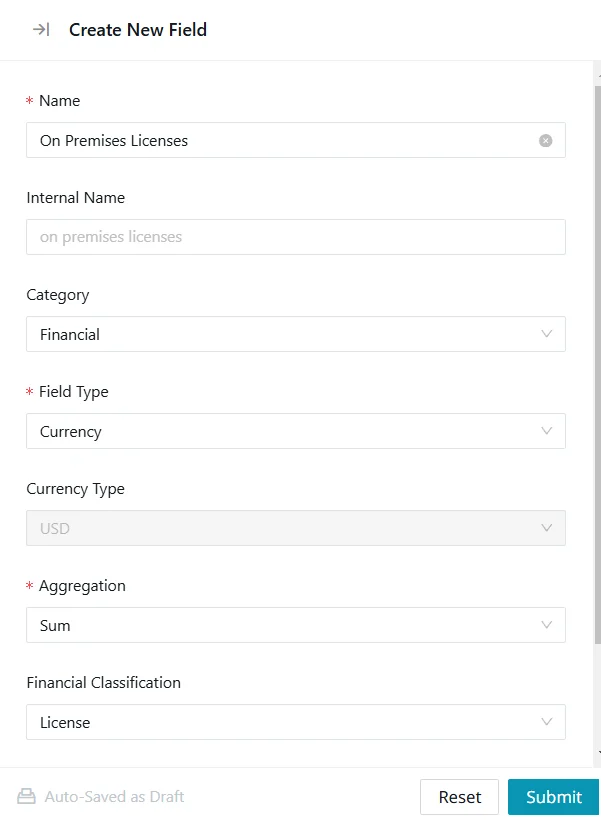
Adding a new field, ‘On Premise License’ with the classification selected
💡 Tip: Use the Financial Classification field to ensure expenses are categorized correctly for reporting and cost comparisons.
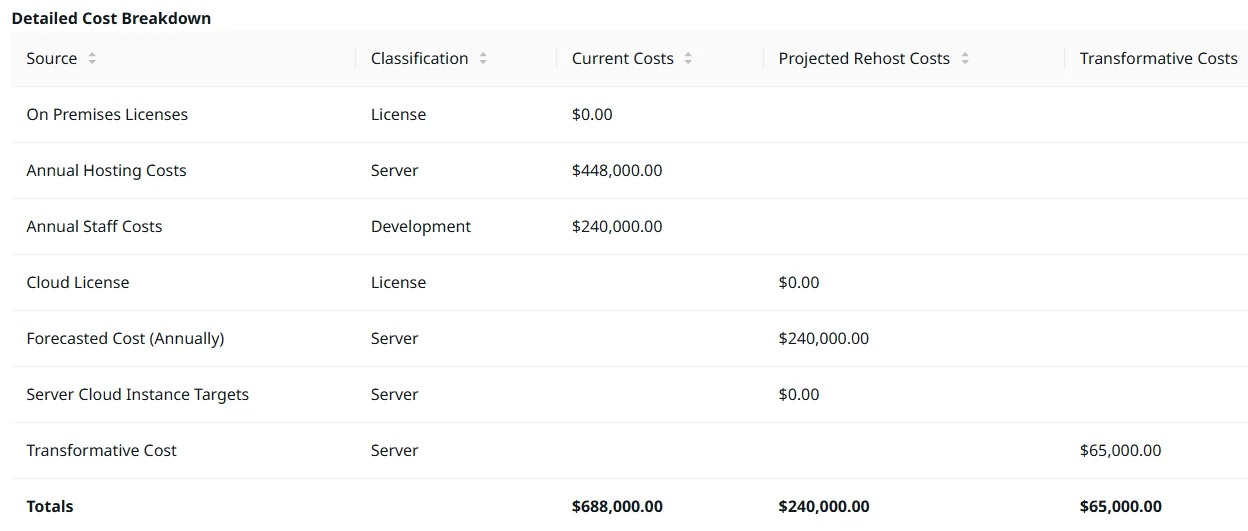
Now the new license fields appear and are categorized correctly under current costs and projected rehost costs
Once costs are entered, the Financial Impact Tool automatically generates ROI projections and cost comparisons.
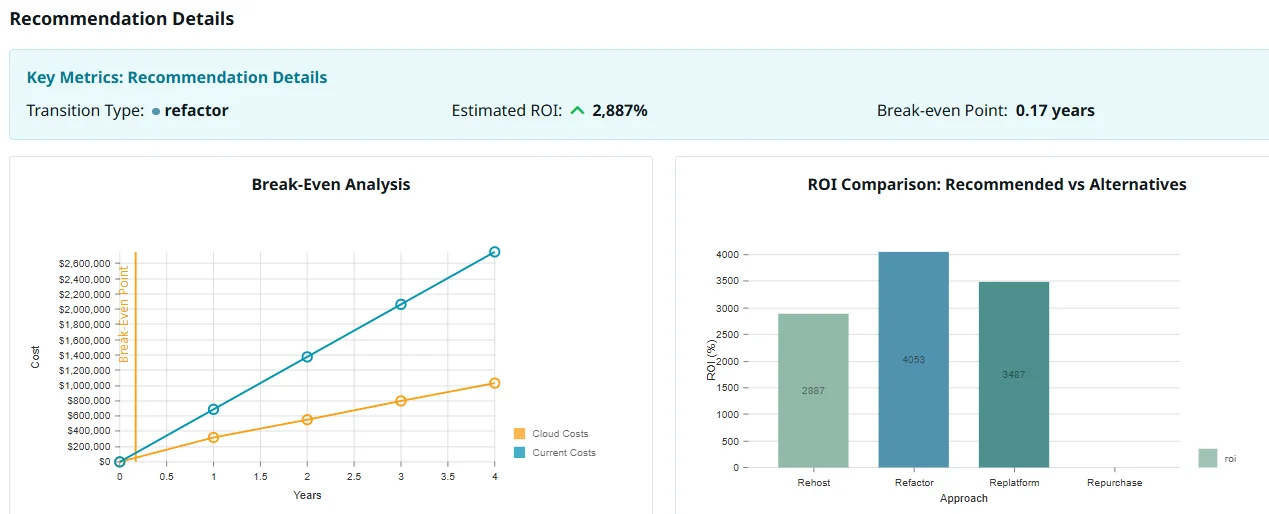
Key Metrics: Recommendation details with Break-Even Analysis and ROI Comparison
💡 Pro Tip: If ROI comparisons aren’t showing, verify your migration costs under Transition Planning.

Step 5: Generating Reports
The Financial Impact Tool provides clear, printable reports with a branded cover sheet, making them ideal for financial planning and stakeholder discussions.
To generate a report:
- Navigate to the project
- Select the Financial Impact tab
- Click Print for a polished, presentation-ready document
- Review key insights:
- Table of Contents for quick reference
- Overall Project Savings & Projects
- Breakdowns per Application
- Projected vs. actual costs
- Savings opportunities
- Budget allocation insights
The professionally branded report coversheet
📌 For best results, download reports using Google Chrome to ensure proper formatting of fonts and images.

Step 6: Comparing Migration Strategies for Maximum ROI
ROI comparisons help determine the most cost-effective migration approach by evaluating projected savings across different strategies.
Example ROI Breakdown (with easy numbers):
- Current Costs: $10,000 per year
- Rehost: $5,000 per year → 50% savings
- Replatform: $4,000 per year → 60% savings
- Refactor: $3,500 per year → 65% savings
Break-even analysis highlights how cloud migration can rapidly offset costs, especially for organizations adopting modernization strategies.
💡 Pro Tip: If cloud instance targets haven’t been generated, manually enter forecasted costs for accurate ROI projections.
Next Steps
Cloud migration isn’t just about moving workloads—it’s about making strategic financial decisions that maximize ROI. With Tidal Accelerator’s Financial Impact Tool, you can gain real-time cost visibility, optimize spending, and ensure every cloud investment delivers measurable value.
- Sign up for Accelerator and access the Financial Impact Tool
- Create your first project following this blog
- Follow the Financial Impact User Guide for best practices
Don’t just migrate, strategically transform. Start optimizing your cloud investment today with data-driven insights.